Create a statistical report
SimplyReports supports pre-defined summation functions for statistical reporting. When the report is generated in Excel output format, you may apply any of Excel's statistical functions to the report.
Important: To gather transaction data used in SimplyReports statistical reports, Polaris must be set up to log the appropriate transactions. For every type of transaction you want to include in a statistical report, transaction logging must be set to Yes in the Transaction Logging database table in Polaris Administration. The transactions are logged from the point you turn the logging function on. See “Collecting Transaction Statistics” in Polaris staff client Help.
To create a statistical report
Note: Statistical reports are available for patron, patron account, holds, items, bibliographic, authority, and serials reports.
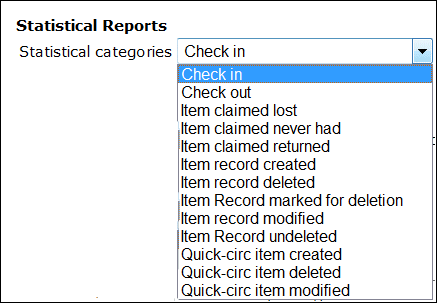
- Select the subtab to create a statistical report.
Note: The statistical categories depend on the kind of statistical report you are creating. For example, for an item statistical report, you could report on transactions involving item records, such as check outs, check ins, or modifications to item records.
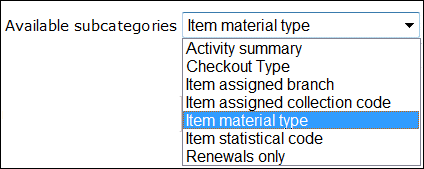
- Select a subcategory. The available subcategories depend on the selected statistical category, and the available filters depend on the selected subcategory. For example, if you select Item material type subcategory for an item statistical report, the only filter available is the material type filter.
- Select the report type and detail level. When you select a report type, the list in the Detail level may display options for the type of report, or it may display Not applicable for this type of report.

You can select the following statistical report types:
- General summary - Displays the transaction totals without chronological breakdown. No detail levels are available for this report type.
- Monthly - Displays the transaction totals broken down by month. Two detail levels are available in the detail level drop-down list:
- Month - Displays the number of the month, and that month's transaction total for the selected statistical category (and subcategory). Selecting only Month will result in aggregation of monthly totals over multiple years.
- Year & Month - Displays the number of the month, the number of the year, and the transaction totals for the selected statistical category (and subcategory).
- Daily - Displays the transaction totals broken down by day-of-month. Detail levels are available in the detail level drop-down list:
- Day - Displays the number of the day, and the transaction totals for the selected statistical category (and subcategory). Selecting only Day will result in the aggregation of daily totals over multiple years.
- Month & day - Displays the number of the day, the number of the month, and the transaction totals for the selected statistical category (and subcategory). Selecting only Month & day will result in aggregation of totals over multiple months and years.
- Year, month, & day - Displays the number of the day, number of the month, number of the year and the transaction totals for the selected statistical category (and subcategory).
- Yearly - Displays the year and the transaction totals for the year selected. No detail levels are available for this report type.
- Hourly - Displays the transaction totals broken down by hour. Four detail levels are in the Detail level drop-down list:
- Hour - Displays the hours and the total number of transactions for each hour.
- Day & hour - Displays the number of the day, the number of the hour, and the transaction totals for the selected statistical category (and subcategory). Selecting only Day & hour will result in the aggregation of hourly totals over multiple months and years.
- Month, day & hour - Displays the number of the month, the number of the day, the number of the hour, and the transaction totals for the selected statistical category (and subcategory). Selecting only Month, day & hour will result in aggregation of totals over multiple years.
- Year, month, day & hour - Displays the number of the hour, number of the day, number of the month, the number of the year, and the transaction totals for the selected statistical category (and subcategory).
- Day of week - Displays transaction totals broken down by day of the week. Three detail levels display in the Detail level drop-down list:
- Day of week - Displays the day of week and the total for the selected transaction category (and subcategory). Selecting only Day of week will result in the aggregation of totals over multiple weeks, months, and years.
- Month & day of week - Displays the number of the month, the day of the week, and the transaction total of the selected category (and subcategory). Selecting only Month and day of week will result in the aggregation of totals over multiple weeks and years.
- Year & day of week - Displays the number of the year, the number of the month, the day of the week, and the transaction total for the selected category (and subcategory). Selecting only Year & day of week will result in the aggregation of totals over multiple weeks.
- Day of week by hour - Displays the day of week, the hour and the transaction totals for the selected category (and subcategory). No detail levels are available.
- Select the report focus. You can run a statistical report by the transacting branch only, or you can include user or workstation detail. If you select Run report by transacting organization only, the options to include user or workstation detail are unavailable.

- Filter by the transacting branch. You can limit the transactions by selecting a branch or branches from the Transacting branch list, which displays all the branches to which you have access. You can include branch information by selecting one of the following options:
- Include branch name (default) - The transacting branch name (defined in Polaris).
- Include branch abbreviation - The abbreviation (defined in Polaris).
- Include branch ID - The Polaris numeric code for the branch.
- Combine branch totals - Branch total aggregation. No individual branch information will appear on the report.
- Filter by workstation/user. You can limit the transactions to those performed by a specific user or on a specific workstation by selecting one of the following options:
Tip: If you selected Run report by transacting organization only, the options to include user or workstation detail are unavailable.
- Include transacting user detail and select a user or users from the User box.
- Include transacting workstation detail and select a workstation or workstations in the Workstation box.
- Filter by date. You can filter statistical reports to include transactions for a specific date range or for a time period relative to the report run date. If you select Date range, select a Start date and End date. See Filter by Date Ranges. If you select Relative date , enter a number and select Days, Months or Years before the report run date. See Filter by Dates Relative to a Report Run Date.
- To include a header row, select the Include header rows box.
Note: The column headers do not have spaces between the words, but after the report is created, you can change them in Excel or in a text file.
- Select the file type for the report:
- Text file - If you select this file format, select an entry in the Delimiter type box.
- Excel - This is the default file type. When you save the report output in this file type, the file is saved in Microsoft Excel format.
Note: When you save a statistical report in Excel format, you can use Excel’s statistical functions after the report is generated.
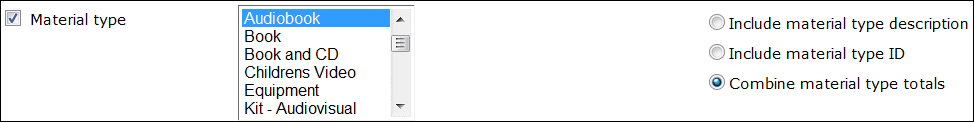
- Use other filters for statistical reports. The available filters for statistical reports depend on the selected subcategory. The filters also have options for including information such as description, ID, or totals.
- Click Submit.
Tip: To preview a statistical report, the Run report now box must be checked before clicking Submit. Running a statistical report immediately may affect system performance.
- Select Save report parameters for later use. See Using Saved Reports.
Related Information
For detailed information on creating specific types of statistical reports, see: